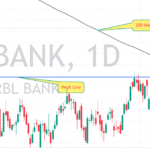
There are moments in the market when a stock’s chart seems to whisper a quiet shift in trend—when old resistances become supports and patterns take shape that hint at a deeper story. One such moment is unfolding on the RBL share price and chart, where a classic Inverse Head and Shoulders pattern has emerged alongside a 200-day Moving Average (MA) breakout. But there’s more. … [Read more...] about 📊 RBL Share Price: Inverse Head and Shoulders Breakout with 200 MA Retest and Fundamental Support