PNB Housing Finance has been making waves in the stock market, and PNB Housing Share Price recent Inverse Head and Shoulder Pattern formation has caught the attention of technical analysts. This pattern, often considered a bullish reversal, suggests a potential shift in momentum, making it a crucial point of interest for traders and investors alike. 🔍 Technical Analysis: … [Read more...] about PNB Housing Share Price: A Deep Dive into Technical & Fundamental Analysis 📈🏡
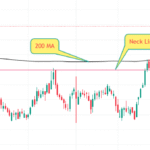
📊 RBL Share Price: Inverse Head and Shoulders Breakout with 200 MA Retest and Fundamental Support
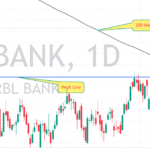
There are moments in the market when a stock’s chart seems to whisper a quiet shift in trend—when old resistances become supports and patterns take shape that hint at a deeper story. One such moment is unfolding on the RBL share price and chart, where a classic Inverse Head and Shoulders pattern has emerged alongside a 200-day Moving Average (MA) breakout. But there’s more. … [Read more...] about 📊 RBL Share Price: Inverse Head and Shoulders Breakout with 200 MA Retest and Fundamental Support
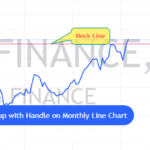
NAM INDIA Chart Pattern: Cup with Handle Breakout Backed by Moving Average Support

In the world of technical analysis, patterns are more than just visuals—they're reflections of investor sentiment, consolidation, and breakout psychology. Recently, the NAM INDIA Chart Pattern revealed one of the most promising bullish continuation patterns: the Cup with Handle. But this isn’t just a technical story—it’s one reinforced by strong financial fundamentals. Let’s … [Read more...] about NAM INDIA Chart Pattern: Cup with Handle Breakout Backed by Moving Average Support
UTI Chart Pattern: Inverse Head and Shoulders Forming with Strong Fundamentals
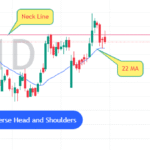
In the world of investing, a combination of technical analysis and fundamental strength can often reveal high-conviction ideas. One such compelling case is currently unfolding on the chart of UTI AMC, where a textbook Inverse Head and Shoulders pattern is forming. Let’s dive into what this means technically and fundamentally. 📉 UTI Chart Pattern Technical Analysis: … [Read more...] about UTI Chart Pattern: Inverse Head and Shoulders Forming with Strong Fundamentals
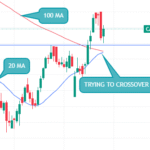
Maruti Suzuki Chart Pattern and Fundamental Analysis: A Detailed Overview
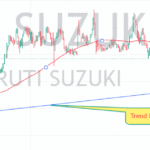
Maruti Suzuki Chart Pattern: Price Action & Moving Averages Maruti Suzuki Chart Pattern is exhibiting strong support on a long-term trend line while crossing above the 100-day moving average (100 MA)—two signals that often indicate a shift in momentum. Key Technical Observations: ✔️ Trend Line Support: The price has been consistently respecting this trend line, … [Read more...] about Maruti Suzuki Chart Pattern and Fundamental Analysis: A Detailed Overview
SBI Life Chart Pattern Analysis: A Technical Perspective
The SBI Life Chart Pattern presents an intriguing opportunity for technical analysis enthusiasts. Showcasing a W pattern breakout coupled with the price crossing above the 200-day moving average (200 MA), this chart demands attention for its potential insights into market sentiment and price action. Understanding SBI Life Chart Pattern ("W" Pattern) The "W" pattern, … [Read more...] about SBI Life Chart Pattern Analysis: A Technical Perspective
PNB Chart Pattern: A Comprehensive Technical Analysis
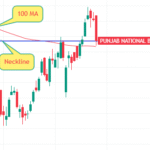
The recent price action of Punjab National Bank (PNB) has showcased a classic Cup with Handle chart pattern, a widely-recognized bullish continuation pattern in technical analysis. Here’s a breakdown of the significant elements of this pattern: PNB Chart Pattern: Cup with Handle Formation The Cup with Handle is identified by a "U"-shaped consolidation phase followed by a … [Read more...] about PNB Chart Pattern: A Comprehensive Technical Analysis
Can Fin Homes Chart Pattern: A Technical and Fundamental Perspective
Can Fin Homes Chart Pattern: Technical Analysis The Can Fin Homes Chart Pattern is currently displaying a promising Cup with Handle pattern, a classic bullish continuation signal in technical analysis. This pattern typically indicates a potential upward movement, with the "cup" representing a rounded consolidation phase and the "handle" signifying a brief pullback before … [Read more...] about Can Fin Homes Chart Pattern: A Technical and Fundamental Perspective