• Skip to main content
  • Skip to secondary menu
  • Skip to primary sidebar
  • Skip to footer
  • Home
  • About Us
  • Privacy Policy
  • Contact Us

Techno Funda

Share, Mutual Funds, Insurance, PF

  • STOCK RESEARCH REPORT
  • Break out stocks for tomorrow
  • MUTUAL FUND
  • INSURANCE

NAM INDIA Chart Pattern: Cup with Handle Breakout Backed by Moving Average Support

May 1, 2025 by Tapan Das 1 Comment

In the world of technical analysis, patterns are more than just visuals—they’re reflections of investor sentiment, consolidation, and breakout psychology. Recently, the NAM INDIA Chart Pattern revealed one of the most promising bullish continuation patterns: the Cup with Handle.

But this isn’t just a technical story—it’s one reinforced by strong financial fundamentals. Let’s explore both sides of this opportunity.

NAM INDIA Chart Pattern

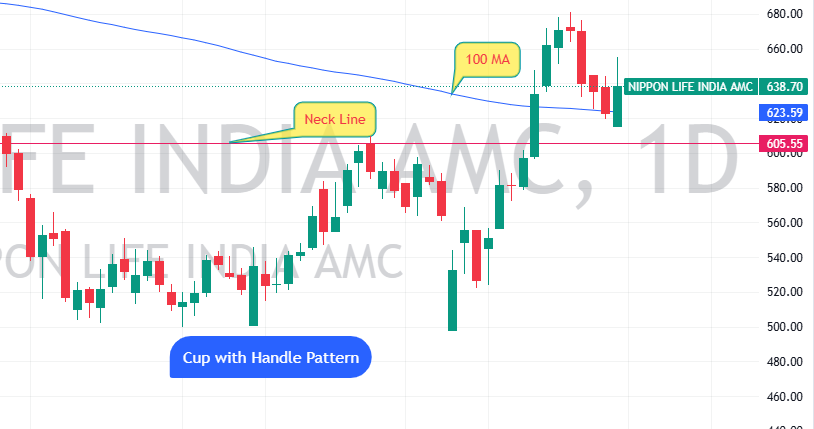
☕ NAM INDIA Chart Pattern Cup with Handle: A Classic Continuation Signal

The Cup with Handle pattern on the Daily NAM INDIA Chart Pattern is not only well-defined, but also technically validated. Here’s what stands out:

  • Rounded base (the Cup) formed after a prolonged downtrend.
  • Handle appeared as a short pullback, reflecting investor hesitation before a breakout.
  • Breakout happened with strong volume, surpassing the neckline.
  • Most importantly, the price broke above the 100-day Moving Average and came back to successfully test it as support—a textbook sign of strength.

This formation often marks the beginning of a sustainable uptrend, especially when volume and momentum support the move.


📈 What the 100-Day Moving Average Tells Us

The 100 MA is no ordinary line—it’s a benchmark followed by institutions. NAM INDIA’s breakout above this moving average and subsequent support retest indicates:

  • A potential trend reversal or continuation after consolidation.
  • Institutional buying interest and confidence.
  • A likely shift in market perception, especially when accompanied by positive fundamentals.

This kind of price behavior, where technical confluence supports a bullish pattern, makes the chart even more meaningful.


💡 Strong Fundamentals Powering the NAM INDIA Chart Pattern

While the technical setup is impressive, NAM INDIA’s fundamental story is equally compelling. The Q4FY25 results show steady growth in revenue and assets under management (AUM), with improving profitability and a strong retail focus.

🔍 Highlights from the Latest Results (FY25):

  • Revenue from operations: ₹22,307 Cr (▲36% YoY)
  • Profit After Tax (PAT): ₹12,857 Cr (▲16% YoY)
  • QAAUM: ₹5.57 lakh Cr (▲29% YoY)
  • SIP AUM: ₹1.3 lakh Cr (▲32% YoY)
  • Market share (overall): 8.3%
  • Core PAT growth: 9% YoY in Q4FY25
  • Equity AUM share: 49.8% of total

📊 Key Financial Table – NAM INDIA Performance at a Glance

MetricFY24FY25FY26EFY27E
QAAUM (₹ Cr)36,83,00054,00,50065,62,84677,37,768
Revenue from Operations (₹ Cr)16,43222,30726,04629,647
Core Operating Profit (₹ Cr)9,93714,41616,94719,295
PAT (₹ Cr)11,06312,85714,60416,535
EPS (₹)17.520.022.825.8
ROAE (%)29.531.434.137.2
Dividend Per Share (₹)16.518.020.823.5
Revenue Yield (bps)49484341

Source: Company Data, Centrum Broking


🧠 Conclusion: When Technicals Align with Fundamentals

The current NAM INDIA chart pattern isn’t just a breakout on paper—it reflects growing investor trust backed by data. With a Cup with Handle breakout, support from the 100-day MA, and a fundamental profile that continues to strengthen, this stock appears to be at a decisive turning point.

⚠️ Disclaimer: As per SEBI regulations, this post does not provide any stock recommendation or target price. Investors should consult with SEBI-registered advisors for investment decisions.

Filed Under: STOCK RESEARCH REPORT Tagged With: nippon india share analysis, nippon india share latest news, nippon india share price, nippon life amc share, nippon life amc share latest news, nippon life india, nippon life india amc share latest news, nippon life india asset management, nippon life india asset management ltd share, nippon life india asset management ltd share analysis, nippon life india asset management ltd share latest news, nippon life india share, nippon life india share news, SIP AUM India

Reader Interactions

Leave a Reply Cancel reply

Your email address will not be published. Required fields are marked *

Primary Sidebar

Categories

  • Break out stocks for tomorrow
  • Information
  • INSURANCE
  • MUTUAL FUND
  • STOCK RESEARCH REPORT
CAGR Calculator

CAGR Investment Calculator

Enter Investment Details

More to See

JIO Mutual Fund: Will It Disrupt the Industry or Just Make It Smarter?

June 6, 2025 By Tapan Das

PM Kisan 20th Installment Date: What Farmers Need to Know in June 2025

June 5, 2025 By Tapan Das

Why IRCON Share Price Is Rising: A Technical & Fundamental Deep Dive

June 5, 2025 By Tapan Das

FII Comeback: Why Foreign Institutional Investors Are Returning to Indian Stock Market

June 4, 2025 By Tapan Das

SEBI’s F&O Revolution: 9 New F&O Rules Every Trader Must Know in 2025

June 2, 2025 By Tapan Das

JK Lakshmi Cement Share – Riding on Strong Fundamentals and Operational Excellence

June 1, 2025 By Tapan Das

Samvardhana Motherson Share: Navigating Growth Amid Industry Challenges

May 31, 2025 By Tapan Das

Jindal Steel Share: Inside the Ambitious Growth Path of JSPL

May 30, 2025 By Tapan Das

Esab India: A Glimpse Into the Steady Performer in Industrial Growth

May 29, 2025 By Tapan Das

Linde India Share: A Deep Dive into a Quiet Industrial Giant

May 28, 2025 By Tapan Das

Footer

Recent

  • Why Yatharth Hospital Is Quietly Emerging as a Healthcare Force in India
  • JIO Mutual Fund: Will It Disrupt the Industry or Just Make It Smarter?
  • PM Kisan 20th Installment Date: What Farmers Need to Know in June 2025
  • Why IRCON Share Price Is Rising: A Technical & Fundamental Deep Dive
  • FII Comeback: Why Foreign Institutional Investors Are Returning to Indian Stock Market

Tags

Best Pension Plan 2025 breakout stocks bullish breakout bullish chart pattern Cams Cup with Handle Pattern Cams Share Breakout Cams Share Price Cup with Handle Breakout Cams Share Price Momentum Above 100 MA Cams Share Price Trend Reversal Pattern Cams Share Resistance and Support Cams Share Retesting Neckline Support Cams Share Trading Strategy Cams Stock Chart Pattern Cams Stock Moving Average Cams Technical Chart candlestick patterns Cotton Yarn cup with handle pattern How to Read Cams Share Technical Chart Immediate Pension Plan Indian stock market Indian Textile Exports India UK FTA Is Cams Share a Good Buy Now? ITC share price trend LIC Annuity Plan LIC Pension Plan LIC Pensoin Calculator Life Annuity LIC NSE stocks Polyester Yarn price action trading rbl bank share Retirement planning India share market Spinning Mills stock breakout Stock breakout patterns Stock chart patterns Stock market blog India stock market india technical analysis textile industry Textile Industry in India trading strategies

Copyright © 2026 · Magazine Pro on Genesis Framework · WordPress · Log in