When the stock market paints a familiar picture, seasoned traders often recognize the signals before the real move begins. One such exciting setup is forming in the Motilal Oswal share chart — a classic “cup with handle” breakout, and this time, the price action has also cleared the crucial 200-day moving average (200 MA).
Let’s dive into what’s happening on the chart and why many technical traders are turning their eyes toward this stock.
🏆 Understanding the Chart Structure in Motilal Oswal Share
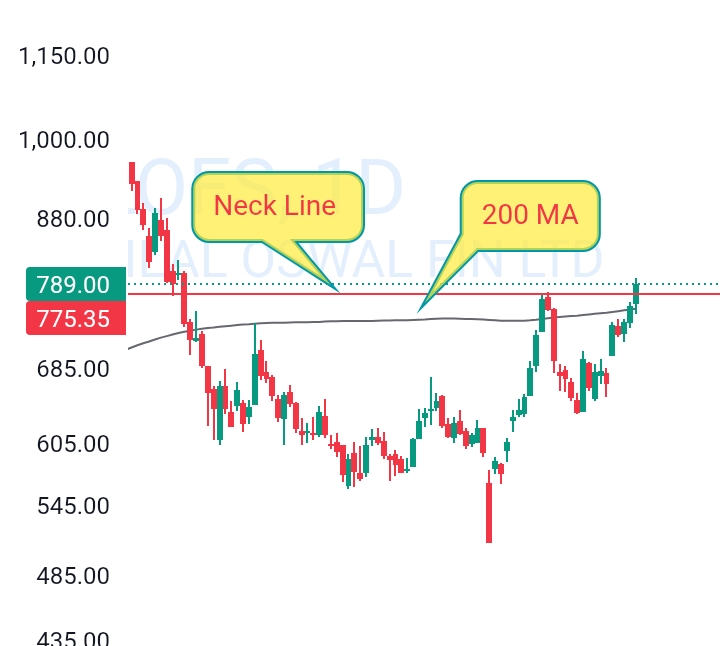
The daily chart of Motilal Oswal Financial Services Ltd reveals a textbook cup with handle pattern, a bullish continuation setup known for signaling the end of a consolidation phase and the potential beginning of a fresh upward trend.
- The “cup” portion formed after a prolonged downtrend, followed by a rounded bottom that reflects accumulation.
- The “handle” formed as a smaller, tighter consolidation — a typical pause before a breakout.
What makes this setup even more compelling is the confluence of resistance around the neckline — and the stock price has now convincingly broken through it.
🚀 Price Breaks Out of the Neckline With Strong Momentum
The neckline, shown clearly on the chart, acted as a key resistance level. After multiple attempts, the price finally surged above it, confirming the breakout. Breakouts with such clarity often suggest strong buyer interest and institutional accumulation behind the scenes.
This move is particularly powerful because the volume during the breakout was significant (not shown in the image, but often the case in such patterns), which is a critical confirmation signal in technical analysis.
🧠 Why the 200-Day Moving Average Matters in Motilal Oswal Share
Technical traders give a lot of weight to the 200-day moving average (200 MA) — and for good reason. It is a long-term trend indicator that acts like a dynamic resistance or support.
In the case of Motilal Oswal share, the price spent a considerable time below the 200 MA. But recently, the price pierced through this level and sustained above it, which indicates a potential shift in the long-term trend from bearish to bullish.
This change of trend, combined with a bullish pattern breakout, creates a strong technical setup for trend-following traders.
🔄 Retest Possible, But Structure Remains Strong
While no breakout move is without its minor pullbacks or consolidation phases, the current structure remains firmly positive.
Many traders will now watch for a potential retest of the neckline or the 200 MA, which could act as support. If the price respects those levels and resumes upward movement, it will only strengthen the bullish narrative around Motilal Oswal share.
📊 What This Means for Medium-Term Traders
If you’re a trader who bases decisions on chart patterns, this setup in the Motilal Oswal share ticks several key boxes:
- ✅ A clean and identifiable cup with handle pattern.
- ✅ Breakout above the neckline resistance.
- ✅ Price moving above the 200-day moving average.
- ✅ A shift in market sentiment from bearish to bullish.
The combination of these technical elements gives traders more confidence to ride the trend rather than chase random spikes.
💡 Broader Implications for the Motilal Oswal Share
Apart from the technicals, keep in mind that market behavior often reflects investor sentiment and expectations. A breakout from a long consolidation typically signals that the smart money is stepping in — this could be due to positive future prospects, improving fundamentals, or overall sector momentum.
And while we’re not diving into the financials in this article, the price action is often the first to react before the broader news cycle catches on.
🛠️ Things to Keep in Mind
Even though this chart setup looks strong, remember that markets are dynamic. Technical analysis is about probabilities, not certainties. The current breakout suggests a strong probability of upside continuation, but being alert to market behavior around support and resistance zones is always wise.
🧭 Final Thoughts on Motilal Oswal Share’s Technical Breakout
The current chart of Motilal Oswal share is a great example of how technical patterns like the cup with handle can offer insights into market psychology and potential price movement. With the price now trading above both the neckline and the 200-day moving average, the stock has moved into a technically bullish zone.
As always, traders should follow their strategy, manage their risk, and stay updated with broader market trends. But there’s no denying — Motilal Oswal share is now on the radar of many technical analysts, and the breakout signals strength that can’t be ignored.
📢 Disclaimer:
The content in this article is for informational and educational purposes only and should not be construed as financial advice or a recommendation to buy or sell any stock. The analysis provided is based on technical chart patterns and general market behavior. Always conduct your own research or consult with a qualified financial advisor before making any investment decisions. The author is not liable for any financial losses incurred based on the information shared. Investing in the stock market involves risk.
You may also like Angel One Share Breaks Out of Inverse Head and Shoulders Pattern
Leave a Reply