• Skip to main content
  • Skip to secondary menu
  • Skip to primary sidebar
  • Skip to footer
  • Home
  • About Us
  • Privacy Policy
  • Contact Us

Techno Funda

Share, Mutual Funds, Insurance, PF

  • STOCK RESEARCH REPORT
  • Break out stocks for tomorrow
  • MUTUAL FUND
  • INSURANCE

Maruti Suzuki Chart Pattern and Fundamental Analysis: A Detailed Overview

April 29, 2025 by Tapan Das Leave a Comment

Maruti Suzuki Chart Pattern Analysis: Trend Line Support & 100 MA Crossover with Fundamental Insights


Maruti Suzuki Chart Pattern: Price Action & Moving Averages

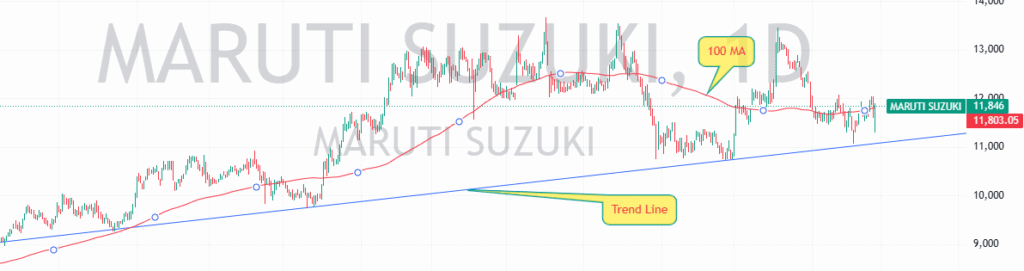
Maruti Suzuki Chart Pattern is exhibiting strong support on a long-term trend line while crossing above the 100-day moving average (100 MA)—two signals that often indicate a shift in momentum.

Key Technical Observations:

✔️ Trend Line Support: The price has been consistently respecting this trend line, implying renewed buyer interest at crucial levels.
✔️ 100 MA Crossover: Breaking above the 100 MA suggests improving sentiment and potential price strength.

Fundamental Analysis: Financial Performance & Growth Drivers

Maruti Suzuki’s fundamental outlook remains promising, despite short-term margin pressures due to rising input costs and industry-wide challenges. The company’s export-led strategy, robust SUV sales, and focus on fuel-efficient models position it well for future growth. Below is an in-depth fundamental assessment based on the latest financial data

Fundamental Snapshot (FY25A – FY27E)

MetricFY25AFY26EFY27E
Revenue (₹ Mn)₹1,519,001₹1,700,560₹1,910,985
EBITDA (₹ Mn)₹177,852₹205,768₹236,962
EBITDA Margin (%)11.7%12.1%12.4%
Adj. Net Profit (₹ Mn)₹139,552₹155,929₹181,572
Adj. EPS (₹)₹443.9₹496.0₹577.5
PE Ratio (x)26.423.620.3
ROE (%)15.7%15.7%16.3%

Growth Drivers & Challenges

🔹 Export Growth: Exports grew 8.1% YoY and are expected to surge 20% YoY in FY26, driving the company’s expansion despite domestic demand fluctuations.
🔹 SUV Dominance: SUVs account for ~45% of total sales, reinforcing market leadership in high-demand segments.
🔹 Margin Pressure: Higher commodity costs, increased advertising spend, and seasonal expenses led to a 177bps YoY EBITDA margin decline.
🔹 Future Outlook: Management expects steady retail demand and strong momentum in EV & fuel-efficient models, supporting sustained profitability.

Conclusion

The Maruti Suzuki chart pattern suggests a potential bullish structure supported by technical signals. Meanwhile, the company’s fundamentals remain strong, with export-led growth, a shift toward SUVs and EVs, and strategic pricing decisions to offset rising costs.

Filed Under: STOCK RESEARCH REPORT Tagged With: maruti share latest news, maruti share news, maruti suzuki, maruti suzuki news, maruti suzuki share, maruti suzuki share analysis, maruti suzuki share latest news, maruti suzuki share latest news today, maruti suzuki share news, maruti suzuki share news today, maruti suzuki share price, maruti suzuki share price analysis, maruti suzuki share price target, maruti suzuki share target, maruti suzuki stock, maruti suzuki stock analysis

Reader Interactions

Leave a Reply Cancel reply

Your email address will not be published. Required fields are marked *

Primary Sidebar

Categories

  • Break out stocks for tomorrow
  • Information
  • INSURANCE
  • MUTUAL FUND
  • STOCK RESEARCH REPORT
CAGR Calculator

CAGR Investment Calculator

Enter Investment Details

More to See

JIO Mutual Fund: Will It Disrupt the Industry or Just Make It Smarter?

June 6, 2025 By Tapan Das

PM Kisan 20th Installment Date: What Farmers Need to Know in June 2025

June 5, 2025 By Tapan Das

Why IRCON Share Price Is Rising: A Technical & Fundamental Deep Dive

June 5, 2025 By Tapan Das

FII Comeback: Why Foreign Institutional Investors Are Returning to Indian Stock Market

June 4, 2025 By Tapan Das

SEBI’s F&O Revolution: 9 New F&O Rules Every Trader Must Know in 2025

June 2, 2025 By Tapan Das

JK Lakshmi Cement Share – Riding on Strong Fundamentals and Operational Excellence

June 1, 2025 By Tapan Das

Samvardhana Motherson Share: Navigating Growth Amid Industry Challenges

May 31, 2025 By Tapan Das

Jindal Steel Share: Inside the Ambitious Growth Path of JSPL

May 30, 2025 By Tapan Das

Esab India: A Glimpse Into the Steady Performer in Industrial Growth

May 29, 2025 By Tapan Das

Linde India Share: A Deep Dive into a Quiet Industrial Giant

May 28, 2025 By Tapan Das

Footer

Recent

  • Why Yatharth Hospital Is Quietly Emerging as a Healthcare Force in India
  • JIO Mutual Fund: Will It Disrupt the Industry or Just Make It Smarter?
  • PM Kisan 20th Installment Date: What Farmers Need to Know in June 2025
  • Why IRCON Share Price Is Rising: A Technical & Fundamental Deep Dive
  • FII Comeback: Why Foreign Institutional Investors Are Returning to Indian Stock Market

Tags

Best Pension Plan 2025 breakout stocks bullish breakout bullish chart pattern Cams Cup with Handle Pattern Cams Share Breakout Cams Share Price Cup with Handle Breakout Cams Share Price Momentum Above 100 MA Cams Share Price Trend Reversal Pattern Cams Share Resistance and Support Cams Share Retesting Neckline Support Cams Share Trading Strategy Cams Stock Chart Pattern Cams Stock Moving Average Cams Technical Chart candlestick patterns Cotton Yarn cup with handle pattern How to Read Cams Share Technical Chart Immediate Pension Plan Indian stock market Indian Textile Exports India UK FTA Is Cams Share a Good Buy Now? ITC share price trend LIC Annuity Plan LIC Pension Plan LIC Pensoin Calculator Life Annuity LIC NSE stocks Polyester Yarn price action trading rbl bank share Retirement planning India share market Spinning Mills stock breakout Stock breakout patterns Stock chart patterns Stock market blog India stock market india technical analysis textile industry Textile Industry in India trading strategies

Copyright © 2026 · Magazine Pro on Genesis Framework · WordPress · Log in