The stock market is a storybook written in candlesticks. 📘 And lately, IRCON International Ltd is scripting an interesting chapter. If you’ve been watching the ircon share price, you probably noticed a classic “Cup with Handle” pattern forming on the chart—followed by a confident breakout above the 200-day moving average (200MA). 💥
But what does this mean for investors? Is it just a technical phenomenon, or is there solid ground beneath the breakout? In this article, we’ll explore the technical chart of IRCON, fundamental metrics, and recent developments that make this move noteworthy.
🔍 IRCON Share Price and the “Cup with Handle” Breakout
A “Cup with Handle” is a bullish continuation pattern that suggests a stock has paused before continuing its uptrend. It consists of two phases:
- ☕ Cup: A rounded bottom, showing recovery from a correction.
- 🔧 Handle: A short pullback before a breakout, indicating profit booking before bulls charge in.
In the case of ircon share price, here’s what we’re seeing:
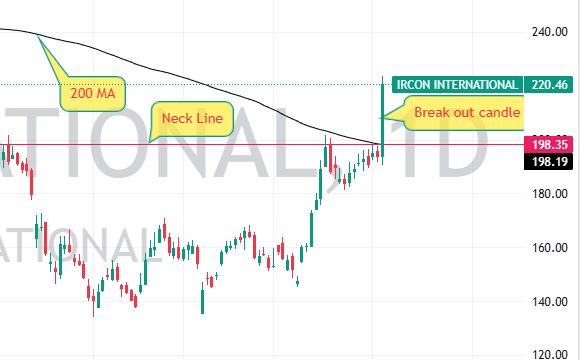
- ✅ The cup formed between late 2023 and early 2024.
- ✅ The handle consolidated just below ₹200.
- ✅ A strong breakout candle pierced through the neckline and the 200MA, touching ₹220.46.
This breakout is significant because the 200MA acts like a dynamic resistance. A candle closing above it shows a shift in long-term sentiment. IRCON’s chart is now aligned with bullish momentum.
📊 Technical Analysis of IRCON Share Price
Let’s break down the chart further:
🧾 Key Technical Indicators (as of recent close):
| Indicator | Value | Interpretation |
|---|---|---|
| Current Price | ₹220.46 | Broke out above neckline |
| 200-Day MA | ₹198.35 | Crossed with a bullish candle |
| RSI (14) | ~61 | Healthy – not overbought |
| Volume | Spike | Confirms breakout strength |
| Pattern Formed | Cup with Handle | Strong bullish signal |
The ircon share price also closed above a major resistance level that had held firm for months. When combined with volume, this adds credibility to the breakout.
📈 What Makes This Breakout Special?
Many stocks bounce above short-term moving averages. But breaking above a 200-day moving average after a textbook bullish pattern like Cup with Handle? That’s a whole different story. 📖
- 🔓 It signals institutional buying.
- ⚒️ It means past resistance may become support.
- 💪 It reflects renewed confidence in IRCON’s long-term prospects.
🏢 IRCON: A Snapshot of the Company
Before diving into fundamentals, a quick overview:
- 👷 IRCON International Ltd. is a Mini Ratna Category-I PSU under the Ministry of Railways.
- 🛤️ It’s involved in engineering and construction of transport infrastructure—especially railway projects in India and overseas.
- 🌍 The company operates in India, Malaysia, Nepal, Bangladesh, Sri Lanka, and more.
💰 Fundamental Analysis: Is There Value Behind the Charts?
Let’s now look beyond the chart. Here’s what Screener.in reveals about IRCON’s fundamentals:
📌 Key Financials (FY24 Consolidated):
| Metric | Value |
|---|---|
| Market Cap | ₹20,700+ Cr |
| P/E Ratio | 28.5 |
| Dividend Yield | 1.41% |
| ROCE | 12.1% |
| ROE | 11.9% |
| Promoter Holding | 65.00% |
| Debt-to-Equity | 0.08 (very low) |
| EPS (TTM) | ₹7.76 |
These numbers paint a picture of a financially sound and low-debt company, with consistent dividend payouts. The low debt-to-equity ratio is a big positive for investors wary of risk.
🔑 Keyword Insight: All these factors add strength to the ongoing momentum behind the ircon share price.
🛠️ IRCON’s Ongoing Projects & Growth Triggers
IRCON has been bagging high-value infrastructure contracts, which help underpin the bullish trend.
📣 Recent Highlights:
- 🏗️ Electrification Project: IRCON completed speed trials and inspection of Mariani-Simaluguri-Dibrugarh rail sections.
- 🌉 Sivok-Rangpo Rail Project: Crucial for North-East connectivity. Progress includes launching girders and tunnel works.
- 🚆 Metro Contracts: Bagged orders worth ₹530+ Cr including Central Railway and Mumbai Metro works.
These developments don’t just add to revenue—they reinforce the growth narrative supporting ircon share price appreciation.
💡 Institutional Confidence and Public Sentiment
- 📊 The breakout pattern may attract technical traders.
- 🏦 The strong fundamentals could lure long-term investors.
- 📈 Positive news flow and order wins enhance public sentiment.
Together, these factors create multi-layered support for the current rally in ircon share price.
📉 Risks to Keep in Mind (Not Everything is Green)
While the chart looks bullish, it’s always wise to stay grounded:
- 🚧 Execution delays in large infra projects.
- 💼 Policy changes or budget constraints.
- 📉 Broader market correction may impact stock despite good performance.
Risk management should always be part of your analysis.
📘 Summary: The Perfect Blend of Chart and Fundamentals
To recap the key takeaways:
✅ A perfect Cup with Handle pattern has formed
✅ Breakout above 200-day MA with volume confirmation
✅ Strong order book and fundamentals
✅ Low debt and high promoter confidence
✅ Bullish public and institutional sentiment
The ircon share price has given technical analysts a textbook setup, and fundamental investors plenty to be optimistic about.
📢 Final Thought (No Advice)
While patterns like this are powerful, it’s not a crystal ball. Technical and fundamental synergy matters—but disciplined observation is key.
📜 This article is for educational purposes only. It does not constitute a recommendation to buy or sell any stock. Please consult with a SEBI-registered advisor before investing.
Leave a Reply