The Godfrey Philips share price has recently shown a strong technical breakout, catching the attention of seasoned traders and long-term investors alike. With the stock forming a classic cup pattern and successfully breaking out above a key resistance level, it signals potential for further upside momentum. In this post, we’ll analyze the recent price action of Godfrey Philips from a technical standpoint, explore the significance of the cup formation, and discuss what this breakout could mean for traders moving forward.
🏢 Overview of Godfrey Philips
Godfrey Philips India Ltd is one of the largest players in the tobacco industry in India. Over the years, the company has diversified its product line, yet remains primarily known for its tobacco products. Given the regulatory challenges and cyclical nature of the industry, the stock tends to be volatile, offering good opportunities for traders who can time the entries and exits well using technical indicators and patterns.
📊 Godfrey Philips Share Price: Recent Rally and Cup Formation
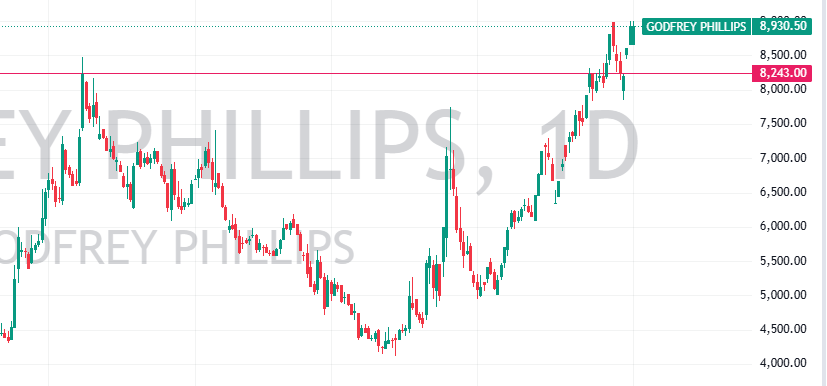
A look at the daily chart of Godfrey Philips share price reveals an impressive rally from the lows near ₹4,200 to the recent high around ₹8,930.50. This near-doubling of the stock price over a few months shows increasing bullish sentiment and strong accumulation at lower levels.
What’s particularly interesting is the formation of a cup pattern, also known as a cup and handle formation in technical analysis. The cup pattern is a bullish continuation pattern that resembles the shape of a teacup. It typically indicates a period of consolidation followed by a breakout, which often results in a strong upward move.
In the case of Godfrey Philips, the cup formation is clearly visible on the chart, with a smooth, rounded bottom that suggests a strong base formation. This structure reflects a shift in control from sellers to buyers over a period of time. The stock corrected from previous highs, consolidated, found strong support, and then steadily moved upwards, completing the cup shape.
🔓 Breakout Above Resistance
The most notable aspect of the current price movement is the breakout above the resistance level of ₹8,243, which had previously acted as a strong barrier. This breakout is significant for several reasons:
- 📌 Volume Confirmation: Breakouts accompanied by higher-than-average volume tend to be more reliable.
- 📌 Psychological Shift: Breaking a prior resistance level signals that buyers are confident in pushing prices higher.
- 📌 Trend Continuation: The breakout confirms the bullish trend that began at the bottom of the cup.
🛡️ Support and Resistance Levels
After the breakout, the previous resistance of ₹8,243 now turns into a key support level. In technical terms, this is known as a role reversal. If the stock retests this level and holds, it would further confirm the strength of the breakout.
- 📍 Support: ₹8,243 (previous resistance)
- 📍 Resistance: Recent highs around ₹8,930.50 (potential psychological level)
📐 Moving Averages and Momentum on Godfrey Philips Share Price
Technical indicators such as moving averages (like the 50-day and 200-day EMAs) help confirm the trend direction. If the Godfrey Philips share price remains above these moving averages, it adds further strength to the bullish bias.
- ⚡ Momentum Indicators: Tools like RSI (Relative Strength Index) are useful to measure if the stock is overbought or has more room to rally.
- ⚡ Ideal Setup: RSI climbing but not yet overbought is typically a sweet spot for further gains.
👀 What Traders Should Watch Next on Godfrey Philips Share Price
Now that the Godfrey Philips share price has broken out of the cup formation, traders should closely watch for:
- 🔄 Volume follow-through: Sustained high volume after breakout = strength.
- 🔄 Retest of breakout zone: A pullback to ₹8,243 with a bounce could offer a good entry.
- 🔄 New patterns: Watch for flag, pennant, or consolidation patterns.
Always use risk management – no chart is ever a guarantee.
🌐 Broader Market Sentiment
The performance of Godfrey Philips should also be considered in context of broader market trends. If the Nifty 50 and Sensex are also in bullish trends, it increases the chances of sustained rallies in mid and large-cap stocks like Godfrey Philips.
- 📈 Market-wide positivity adds support to breakout plays.
- 📉 Caution is needed if indices show signs of reversal or macroeconomic pressures.
📝 Final Thoughts
In conclusion, the Godfrey Philips share price has shown a technically strong breakout from a classic cup pattern, which is generally a bullish indicator. With support now forming around ₹8,243, the structure suggests continued upside is possible, as long as the breakout is respected and supported by volume.
- ✅ No targets given – instead, focus on structure and signals.
- ✅ Ideal for short- to medium-term traders looking for continuation setups.
- ✅ Watch price action, manage risk, and trade with discipline.
You may also like Centrum Broking: Praj Industries Share Price Target 2025
Leave a Reply