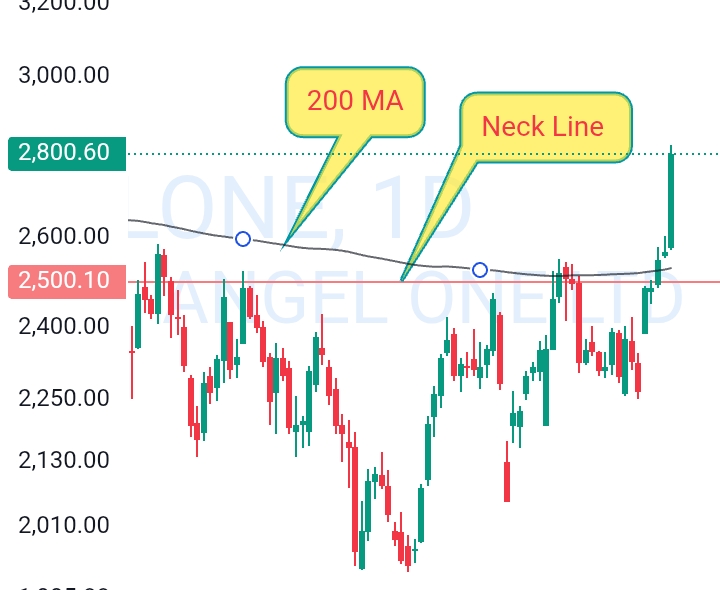
If you’re watching Angel One Share, now is the time to pay attention. The daily chart just flashed a powerful bullish signal — a breakout from an inverse head and shoulders pattern. This classic reversal pattern suggests that the trend may be shifting from bearish to bullish, and technical traders are taking note.
🧠 What is an Inverse Head and Shoulders Pattern?
Before diving into the breakout, let’s quickly break down what this pattern means.
An inverse head and shoulders is a bullish reversal pattern that appears after a downtrend. It consists of three parts:
- A left shoulder, formed by a short decline and rebound,
- A head, which dips lower than the shoulders, and
- A right shoulder, similar in size to the left, followed by a breakout above the neckline.
When the price crosses the neckline, it often signals the start of a potential uptrend. And that’s exactly what we’re seeing with Angel One Share.
💡 Angel One Share: Clean Neckline Breakout
In the current chart, Angel One Share formed a textbook inverse head and shoulders over several weeks. The neckline, which acted as resistance during the formation, was finally broken with a strong bullish candle.
The breakout didn’t just pierce through the neckline — it did so with strong momentum and a spike in buying volume. That’s one of the key confirmations traders look for to validate a breakout.
📊 Break Above the 200-Day Moving Average 🟢
What adds more weight to this breakout is the position of the 200-day moving average (200 MA). This long-term indicator often acts as a dynamic resistance — and in this case, Angel One Share surged above it with authority.
A move above the 200 MA is significant because it shows a shift in market sentiment. Long-term investors begin to view the stock more favorably when it trades above this level.
📌 100-Day Moving Average Breakout Adds Confirmation 🔍
Earlier, during the formation of the right shoulder, Angel One Share also crossed above the 100-day moving average (100 MA). This added an early sign that bullish momentum was building up behind the scenes.
While many traders focus on the 50 or 200 MA, the 100 MA is an important medium-term trend indicator. Its breakout acted like a stepping stone toward the larger neckline breakout.
🧭 Volume Tells the Story
One of the strongest confirmations of this pattern is volume. During the breakout candle, trading volume expanded — a classic hallmark of a genuine breakout. Smart money usually steps in during these moments, giving the move credibility.
A low-volume breakout can often lead to a fakeout. But in Angel One Share’s case, volume is supporting the price action, which makes the setup more trustworthy.
💬 Market Sentiment Turning Positive
Traders and analysts alike are beginning to take a fresh look at Angel One Share. The technical setup has flipped from neutral or bearish to clearly bullish. After weeks of sideways and uncertain movement, this breakout is acting as a wake-up call to many who were sitting on the sidelines.
The shift in sentiment is not just visible on the chart — it’s also reflected in market buzz and growing interest in the stock.
📉 Resistance Levels Now Acting as Support
The neckline and the moving averages that once acted as resistance are now likely to become support levels. This is typical after a breakout, especially in a clean inverse head and shoulders pattern.
What’s interesting is that Angel One Share also overcame psychological resistance near ₹2,600–₹2,800. These levels had previously capped upward moves, but the current momentum has pushed past them, hinting at strong bullish control.
📈 Indicators Support the Bullish View
Besides the chart pattern and moving averages, technical indicators like RSI and MACD are aligning with the bullish outlook.
- RSI is trending upward but remains below overbought levels, which means there’s still room for more movement.
- MACD has shown a bullish crossover, which often precedes a sustained price rally.
These indicators don’t predict the future, but they provide useful confirmation of what the chart is already telling us.
🛠️ Angel One Share: Built on Strong Technical Foundation
What makes this setup even more appealing is the structural integrity of the pattern. The inverse head and shoulders wasn’t rushed — it developed over time with clear symmetry and depth.
That kind of pattern maturity often leads to more sustainable moves. It’s not just a spike; it’s a breakout built on a solid base.
🔍 No Need to Rush — Let Price Speak
Even though this breakout looks promising, there’s no need to rush. Technical breakouts often come with a pullback or retest of the neckline. That’s not a bad thing — in fact, it can offer a more favorable entry for those who missed the initial move.
The key is to watch how Angel One Share behaves in the next few sessions. Follow-through is critical to confirm the strength of this breakout.
📢 Final Thoughts on Angel One Share Technical Setup
In summary, Angel One Share has triggered a significant technical breakout from an inverse head and shoulders pattern. With support from both the 100-day and 200-day moving averages, increasing volume, and confirming indicators, this move looks more than just a random spike.
The technical structure suggests a potential shift in trend, and traders should definitely keep it on their radar. Whether you’re a swing trader or a positional investor, the price action is worth watching closely.
🎯 Stay Tuned for More Angel One Share Updates
As always, chart patterns don’t guarantee results — but they offer a high-probability framework to guide your decisions. Angel One Share has made a bold move, and if price continues to respect the breakout zone, this could be the start of a new trend.
Keep this stock on your watchlist, and let the price action do the talking.
Leave a Reply