Ambuja Cement has been a key player in the Indian cement industry, showing strong financial performance and strategic expansions. Investors are closely watching Ambuja Cement Share Price movement, given the technical patterns forming on the chart and fundamental improvements in business operations.
In this article, we’ll analyze: ✅ Bullish technical signals like the inverse Head & Shoulder pattern ✅ Moving average crossovers suggesting potential price momentum ✅ Fundamental strengths including profit growth, cost efficiency, and expansion strategies .
📊 Ambuja Cement Share Price Technical Analysis: Bullish Breakout Signals Emerging
1️⃣ Inverse Head & Shoulder Pattern
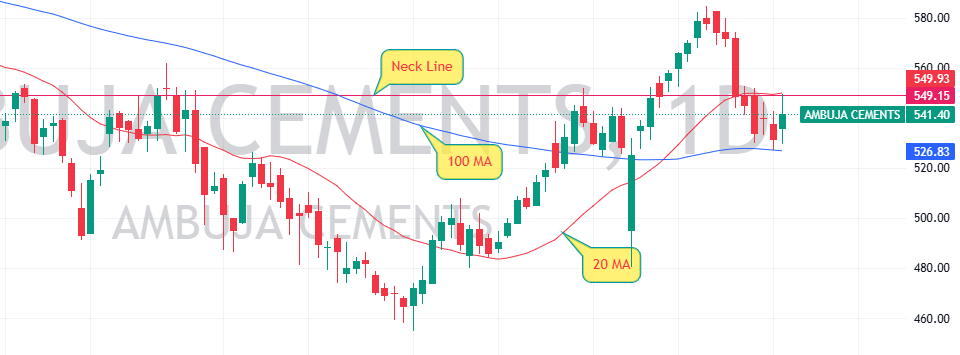
Ambuja Cement’s price movement has formed an inverse head and shoulder pattern, which is a strong bullish reversal indicator. This pattern typically suggests that the stock is gearing up for an upward move, as buyers regain control from sellers.
📌 Structure Breakdown:
- Left Shoulder: A temporary price drop followed by a small recovery.
- Head: A deeper price correction, marking a strong support level.
- Right Shoulder: Buyers stepping in, preventing further decline.
- Neckline: The level that must be breached for a confirmed breakout.
Once the price sustains above the neckline, the pattern is validated, and upward momentum strengthens.
2️⃣ 20-Day MA Crosses Above 100-Day MA
Another bullish signal comes from the 20-day moving average (MA) crossing above the 100-day MA. When this happens, it suggests that short-term buying interest is overtaking long-term trends, indicating potential price appreciation.
🔍 Why This Matters?
- A crossover typically confirms trend momentum shifting upwards.
- Traders interpret this as a sign of bullish strength, prompting additional buying.
3️⃣ Price Holding Support at 100-Day MA
3️⃣Ambuja Cement Share Price Holding Support at 100-Day MA
Ambuja Cement share price is currently taking support at the 100 MA, showing that investors are defending this level, preventing further downside.
📌 Support levels are crucial for:
- Establishing price stability before a major move.
- Confirming buyer interest at key points.
- Indicating lower risk for long-term investors.
📈 Technical Summary Table
| Indicator | Value | Interpretation |
|---|---|---|
| Pattern Formation | Inverse Head & Shoulder | Bullish Reversal |
| 20 MA vs 100 MA | 20 MA crosses above 100 MA | Positive Trend Signal |
| Support Level | 100 MA | Strong Buying Interest |
| Breakout Confirmation | Price Holding Above 100 MA | Momentum Building |
| Investor Sentiment | Bullish | Market Confidence Increasing |
🔎 Fundamental Analysis: Growth, Expansion & Cost Control
Ambuja Cement’s Q4FY25 earnings highlight strong financial improvements, supported by higher volume growth and effective cost management strategies
🏗 Expansion Strategy: Cement Capacity to Reach 140mn MT by FY28
The company is aggressively expanding its production capacity, with a goal of reaching 140mn MT by FY28. Key developments:
- Recent acquisitions completed in FY25.
- Focus shifting to organic growth via brownfield expansions.
- Next phase of capex investment targeting efficiency improvements.
💰 Cost Optimization Measures
Ambuja Cement has outlined specific strategies to reduce operating costs to ₹3,650 per MT by FY28: 1️⃣ Better fuel efficiency & higher AFR share 2️⃣ Procurement of fly ash from Adani Power 3️⃣ Improved rail & marine transport to cut logistics costs 4️⃣ Lower-cost petcoke imports to optimize expenses
The result? Higher EBITDA per MT, boosting profitability.
📌 Management targets ₹1,500 EBITDA per MT by FY28, showing the company’s focus on margin expansion.
📊 Financial Performance Table
| Metric | Q4FY25 | YoY Change |
|---|---|---|
| Revenue | ₹98.9bn | +11.2% |
| EBITDA | ₹18.6bn | +9.9% |
| Net Profit | ₹11.4bn | +8.5% |
| Operating Cost (₹/mt) | ₹4,299 | -3% |
📈 Key Financial Metrics for Investors
Ambuja Cement’s strong financial position, solid market presence, and low debt levels make it a compelling investment choice.
📌 Fundamental Overview Table
| Parameter | Value |
|---|---|
| Market Cap | ₹1,33,354 Cr |
| Current Price | ₹541 |
| 52-Week High/Low | ₹707 / ₹453 |
| Stock P/E | 31.9 |
| ROCE | 10.6% |
| ROE | 8.81% |
| Debt to Equity | 0.01 (Almost Debt-Free) |
| Promoter Holding | 67.6% |
| Profit Growth | 23.7% |
🎯 Conclusion: A Strong Investment Case
Ambuja Cement presents a solid investment case, backed by: ✅ Bullish technical signals including moving average crossover & inverse head & shoulder pattern ✅ Fundamental growth, including volume expansion, cost optimization & profit improvements ✅ Strong promoter holding (67.6%), indicating confidence in the business model ✅ Efficient capex allocation, ensuring higher return on investment.
Ambuja Cement’s share price movements, coupled with healthy financial performance, indicate potential for steady growth.
You can also see this Inverse Head and Shoulders Pattern on UTI
Leave a Reply