When the market starts rewarding patience and pattern recognition, it often points toward a breakout that’s been brewing for weeks, if not months. And in this case, Cams Share Price—short for Computer Age Management Services—is making waves on the technical charts with a classic and powerful bullish pattern: the Cup with Handle breakout.
In this post, we’re going to break down exactly what’s going on with Cams technically, why the recent price action matters, and how traders may want to interpret it. No speculation, no wild predictions—just pure chart reading and pattern-based analysis.
📊 What’s Happening in the Cams Share Price Chart?
Recently, the daily chart of Cams has painted a textbook Cup with Handle formation. This is a well-known bullish continuation pattern that typically forms after a downtrend followed by a rounded bottom (the “cup”) and a short consolidation or dip (the “handle”).
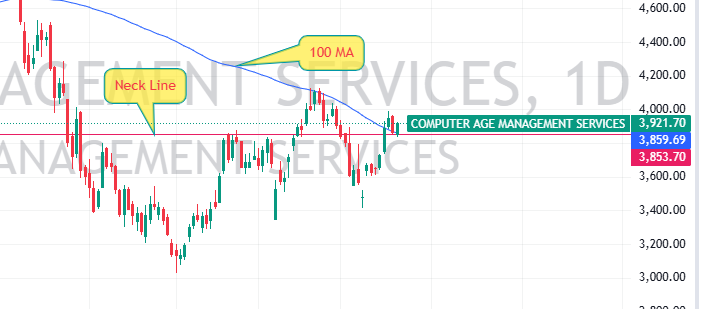
What makes this setup especially compelling is that the breakout didn’t just occur randomly—it broke out with strength above the 100-day moving average (100 MA) and has now come back to retest a very significant neckline level. This alignment of price action and technical indicators often speaks to increasing strength and institutional interest.
📌 Understanding the Cup with Handle Pattern in Cams Share Price
The Cup with Handle pattern is a favorite among technical analysts for a reason—it works more often than not, especially when volume and moving averages confirm the move. Here’s what we see in the Cams Share Price chart:
- ☕ Cup Formation: After a significant fall, the stock gradually bottomed out and formed a wide “U” shape, indicating the accumulation phase.
- 🏷️ Handle Formation: A smaller dip followed the rounding bottom. This shakeout clears out weak hands and builds up energy for a potential breakout.
- 💥 Breakout Above Neckline: The price then surged above the neckline, a horizontal resistance drawn from the highs of the cup.
- 🧭 100 MA Break: The breakout happened above the 100-day moving average, which often acts as dynamic resistance. Breaking above it is a key bullish sign.
- 🔄 Retest: Post-breakout, the price pulled back slightly to test the neckline again, which is now acting as support.
🔍 Why the 100-Day Moving Average Matters in This Breakout of Cams Share Price
One of the most significant technical confirmations in this Cams move is the breakout above the 100-day moving average. This moving average is widely followed by swing traders and institutions alike. It’s often seen as a dividing line between medium-term bullish and bearish sentiment.
What we observe:
- The 100 MA was previously acting as a strong resistance.
- Price struggled multiple times around this level before finally pushing above it.
- The breakout was accompanied by higher volume, further strengthening the signal.
Now, with price hovering around the neckline after the breakout, this area becomes a key demand zone. If the retest holds (which it currently seems to be doing), it sets the stage for potential continuation of the upward trend.
🧩 Technical Confluence: More Than Just a Pattern
When you analyze charts, it’s rarely just one indicator or pattern that makes the case. What adds credibility to this bullish breakout in Cams Share Price is the confluence of multiple technical elements:
- ✅ Cup with Handle formation – One of the strongest bullish continuation patterns.
- ✅ 100 MA breakout – A sign of medium-term trend reversal.
- ✅ Retest of neckline – Suggests validation of the breakout level.
- ✅ Volume confirmation – Higher-than-average volume on breakout days.
- ✅ Price respecting previous support/resistance zones – Classic technical behavior.
When multiple technical signals point in the same direction, it usually implies greater conviction behind the move.
📌 What Traders Should Watch Next
Although we’re not giving a specific price target (every trader should use their own risk management), here’s what’s crucial from a technical perspective:
- 🔒 Support Zone: Keep an eye on the neckline zone, now a critical support area. If the price consolidates above this, it indicates strength.
- 🔎 Volume Trends: Rising volume on green days will suggest continuation. Flat or falling volume may signal consolidation.
- 📉 Invalidation Level: While we aren’t discussing stop-loss, a breakdown below the neckline with strong bearish volume could invalidate the setup.
- 📆 Time Frame: Patterns like the Cup with Handle can take time to play out. Patience is often rewarded.
🧠 Psychology Behind the Pattern: Why It Works
The Cup with Handle is not just a pattern—it’s a psychological map of market sentiment:
- The “cup” reflects a gradual shift from pessimism to optimism.
- The “handle” represents profit-taking and minor consolidation before new buyers step in.
- The breakout occurs when market participants finally agree on the bullish direction, often pushing the stock higher.
This is exactly the psychology we are seeing with Cams Share Price on the chart.
🗣️ What Are Traders Saying?
Among traders on social platforms and forums, there’s a buzz building around Cams. Many recognize the breakout and are waiting to see if the neckline retest holds. Some see this as a long-term opportunity, while others are treating it as a swing trading setup.
Regardless of strategy, the pattern is undeniable, and the technical story is compelling.
📌 Final Thoughts on Cams Share Price
To sum it all up:
- Cams Share Price has broken out of a Cup with Handle pattern.
- It successfully crossed the 100-day moving average—a key technical milestone.
- The neckline is being retested, which is normal and often healthy.
- The chart currently reflects a bullish bias as long as the price remains above the neckline.
Patterns like these are not guarantees, but they offer well-defined frameworks to analyze market behavior. And right now, the chart of Cams is doing exactly what it should do in a bullish breakout scenario.
If you’re following Cams Share Price, this is a moment to stay alert and observe how the price behaves over the next few sessions. Whether you’re a technical trader or someone who uses charts to support long-term investing decisions, this setup offers a textbook case study in price action and pattern recognition.
Leave a Reply