When it comes to technical chart patterns that excite traders and investors alike, the W pattern—also known as the double bottom—holds a special place. In the case of Astral Ltd, the recent price action on the daily chart is telling a compelling story. After months of sideways consolidation and volatility, a strong technical breakout has emerged that has caught the attention of market participants. Let’s take a closer look at what’s unfolding in the Astral share price and why it might be worth keeping an eye on.
🔍 Understanding the W Pattern on Astral Share Price Chart
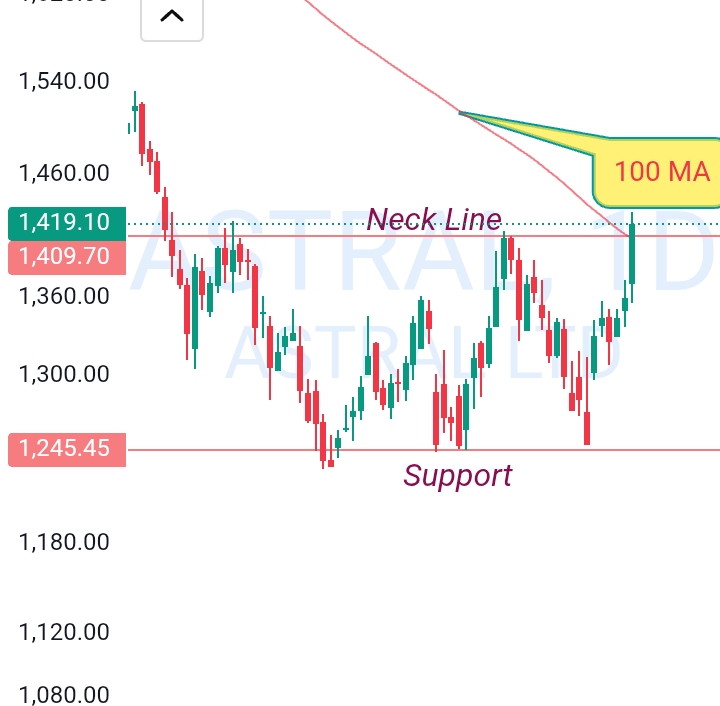
The W pattern, shaped like the letter itself, is a classic reversal setup that often signifies the end of a downtrend. On Astral Ltd’s daily chart, this pattern is clearly visible:
- The first bottom was formed near the ₹1,245 support zone.
- After an intermediate rally, the price retraced again to form a second bottom, creating the signature ‘W’ shape.
- The neckline, which acted as resistance multiple times, lies around the ₹1,410 zone.
This neckline level had been tested more than once, showing its importance. And this week, the Astral share price finally managed to pierce through it with strength.
📊 Breakout Above the 100-Day Moving Average (100 MA)
One of the most bullish confirmations that followed the breakout is the candle closing above the 100-day moving average (100 MA). This moving average had acted as dynamic resistance for several weeks. The fact that price not only touched it but decisively closed above it signals a strong shift in momentum.
This event adds further strength to the W pattern breakout. When such a pattern aligns with a moving average crossover or breakout, it often leads to strong price action in the direction of the breakout.
💡 Why This Breakout Matters for Astral Share Price
There are a few reasons why this breakout holds significance:
- Trend Reversal Signal – After being under pressure for quite some time, the W pattern indicates the end of the previous downtrend.
- Volume Confirmation – Though not visible in the image, such breakouts are often supported by a surge in volume, suggesting participation by both traders and institutions.
- Moving Average Breach – Breaking above the 100 MA confirms that bulls are regaining control.
The combination of all three adds conviction to the move, hinting that the Astral share price could now attempt to enter a new bullish phase.
📌 Support and Resistance to Watch
🟥 Support: The ₹1,245 zone remains a key support level. It acted as a strong floor twice and marked the bottoms of the W pattern.
🟦 Resistance Turned Support: The neckline around ₹1,410 has now flipped from resistance to support after the breakout.
Traders and swing investors will likely be monitoring these zones for potential pullbacks or retests.
📅 Daily Chart Insights for Astral Share Price
By zooming into the daily chart, here’s what we can observe about Astral Ltd:
- A series of higher lows leading up to the breakout—indicating accumulation.
- Bullish candles with strong closing—momentum is favoring the buyers.
- Breach of long-standing moving average—signaling trend reversal.
- Clean neckline breakout—triggers potential upside continuation.
This setup doesn’t emerge every day and could draw in momentum traders who rely on chart patterns to time their entries.
🧠 Market Psychology Behind the W Pattern Breakout
Behind every chart pattern is market psychology at play. The W pattern shows a fight between buyers and sellers:
- The first dip represents panic selling.
- The bounce shows short-term recovery.
- The second dip tests the commitment of bulls.
- The breakout above the neckline reflects growing confidence in the upside.
In Astral’s case, buyers came back stronger on the second dip, and the breakout confirms that control has shifted to the bulls.
💬 What Should Traders Do Now?
While it’s never advisable to chase a breakout too far from the neckline, it is wise to keep this stock on your watchlist. A small pullback or a retest of the neckline zone near ₹1,410 might offer a better entry point for positional traders.
The breakout also opens the door for fresh analysis in the coming days as the price discovers new levels. But for now, all signs indicate strength in the Astral share price.
🔎 Conclusion: Astral Share Price at a Technical Turning Point
To sum it up, Astral Ltd has displayed a textbook W pattern breakout, backed by a strong close above the 100-day moving average. The combination of a reversal pattern, key support/resistance shift, and moving average crossover suggests bullish momentum could sustain.
While no specific target is being suggested, the pattern and moving average breakout indicate a potential shift in the medium-term trend.
Keep monitoring the price action closely and respect the key levels on the chart. Whether you’re a swing trader or a positional investor, the Astral share price deserves a spot on your technical radar.
📍 As always, trade with discipline and stay tuned for further developments.
You may also like Motilal Oswal Share Showing Bullish Signs: Cup with Handle Breakout Above 200 MA
Leave a Reply