Polycab Share Price – A Market Leader’s Performance Unveiled 🔍
Polycab India Ltd. has consistently demonstrated strong financial performance, reinforcing its market leadership in the wires & cables segment. With robust revenue growth, expanding margins, and strategic investments, the company is well-positioned for long-term success. We also will analysis Polycab Share Price.📊
Polycab Share Return Calculator. In this Polycab Share Return Calculator, you can calculate expected return of long term investment.
📈 Polycab Share Return Calculator
💰 Final Investment Value: ₹0
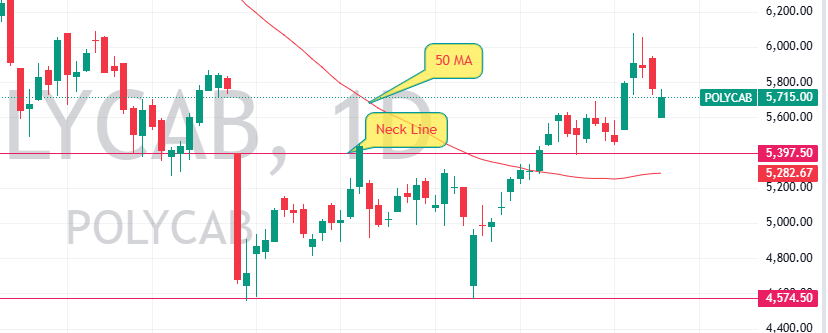
Polycab Share Price: Technical Analysis & Market Trends 📉📊
Polycab’s stock has been exhibiting strong bullish momentum, supported by key technical indicators:
- 50-day moving average (50 MA): The stock is trading above this level, signaling upward momentum.
- Relative Strength Index (RSI): Currently at 72, indicating an overbought zone, which may lead to short-term corrections.
- MACD (Moving Average Convergence Divergence): A bullish crossover confirms positive momentum.
- ADX (Average Directional Index): At 40.5, suggesting a strong trend.
Support & Resistance Levels
- Support: ₹5,397.50, ₹5,282.67
- Resistance: ₹6,077.50
Polycab Share Price: Fundamental Snapshot
| 📌 Metric | 🔢 Value | 📈 YoY Change |
|---|---|---|
| 💰 Revenue | ₹69.9bn | +25% |
| 📊 EBITDA Margin | 14.7% | +110bps |
| 🚀 PAT (Profit After Tax) | ₹7.3bn | +33% |
| 📈 EPS (Earnings Per Share) | ₹48.3 | +32.9% |
| 🏭 Wires & Cables Growth | 22% | 📈 Strong Demand |
| 🔌 FMEG Growth | 33% | ⚡ Broad-Based Expansion |
| 🌍 Export Contribution | Targeting 10% | 🌎 Global Expansion |
| 💸 Capex Investment | ₹60bn-80bn | 🏗️ Growth Strategy |
| 📊 Market Leadership | 26-27% Share | 🔝 Industry Leader |
Fundamental Strengths Driving Polycab Share Price 🚀
Polycab’s fundamental performance remains exceptional, with strong revenue growth, expanding margins, and strategic investments fueling its upward trajectory.
Polycab Revenue Growth & Market Leadership
- Q4FY25 Revenue: ₹69.9bn (+25% YoY) – highest-ever level! 🚀
- Wires & Cables Segment: Grew 22% YoY, driven by healthy demand across key sectors.
- FMEG Segment: Surged 33% YoY, reflecting broad-based growth across product categories.
Polycab Profitability & Margins
- Gross Margin: 25.5% (+20bps YoY)
- EBITDA Margin: 14.7% (+110bps YoY)
- PAT Growth: ₹7.3bn (+33% YoY) – significantly above estimates!
Polycab Strategic Investments & Future Growth Plans 💡
Polycab has outlined ambitious growth targets for FY30, including:
- Wires & Cables Growth: 1.5x industry growth (15-20% CAGR) with 11-13% EBIT margin.
- FMEG Expansion: 1.5-2x industry growth, targeting 8-10% EBIT margin.
- Capex Infusion: ₹60bn-₹80bn, with 4x-5x asset turns potential.
Polycab Share Price: Market Sentiment & Investor Confidence 💰
Polycab’s market leadership, strong financials, and strategic expansion continue to reinforce investor confidence. The company’s export focus, particularly in Europe, the Middle East, and Australia, is expected to drive future growth.
Key Takeaways for Investors
- Bullish Momentum: Supported by technical indicators.
- Fundamental Strength: Revenue & profit growth remain strong.
- Strategic Expansion: Capex investments & export focus will fuel long-term growth.
Leave a Reply