🔍 Introduction: Radico Khaitan Share Price Signals Strength
Radico Khaitan has established itself as a dominant player in the Indian spirits industry, boasting eight millionaire brands and a strong presence in premium and luxury liquor segments. The stock is currently trading at ₹2,538, with a market cap of ₹33,964 Cr. Investors are keenly watching Radico Khaitan Share Price and its Cup with Handle Pattern and 100MA above 200MA, signaling potential bullish momentum.
📊 Understanding the Cup with Handle Pattern of Radico Khaitan Share Price
The Cup with Handle Pattern is a well-known technical formation that suggests a continuation of an uptrend. It consists of:
- A rounded bottom indicating a period of consolidation.
- A slight downward drift, representing a temporary pullback before a breakout.
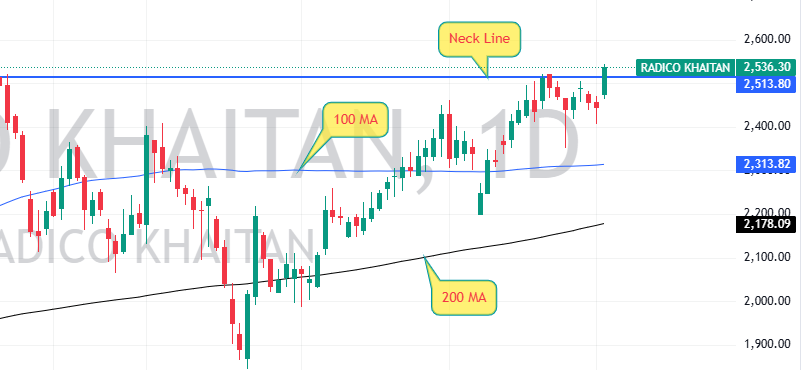
In Radico Khaitan’s case, the neckline of the pattern is a key resistance level. If the stock price successfully breaks above this neckline, it could trigger a strong upward movement.
📉 Moving Averages: A Bullish Confirmation
The 100MA above the 200MA is a significant bullish signal. This suggests that the stock’s recent momentum is stronger than its long-term trend, often leading to sustained price appreciation.
🔥 Key Technical Indicators of Radico Khaitan
Based on recent market data, Radico Khaitan Share Price exhibits the following:
- Relative Strength Index (RSI)📊: Neutral, indicating balanced momentum.
- MACD📉: Slightly bearish, but improving.
- CCI & ADX📈: Showing buy signals, reinforcing bullish sentiment.
- Pivot Points📍: Resistance levels at 2,533.80 and 2,602.60, with support at 2,373.00.
Key Technical Indicators of Radico Khaitan Share Price with Table
| Indicator | Value | Interpretation |
|---|---|---|
| RSI | Neutral | Balanced momentum |
| MACD | Slightly bearish | Improving trend |
| CCI & ADX | Buy signals | Reinforcing bullish sentiment |
| Pivot Points | Resistance at ₹2,533.80 & ₹2,602.60 | Support at ₹2,373.00 |
🚀 Market Outlook for Radico Khaitan Share Price
Given the Cup with Handle Pattern and the 100MA above the 200MA, Radico Khaitan’s stock is poised for a potential breakout ⚡. Traders should monitor the neckline resistance and volume trends to confirm the move.
📊 Fundamental Analysis: Financial Strength & Growth Potential of Radico Khaitan
Radico Khaitan’s financials indicate strong profitability and growth potential, supported by premiumization, backward integration, and strategic expansion.
📌 Key Financial Metrics of Fundamental Analysis of Radico Khaitan
| Metric | Value | Interpretation |
|---|---|---|
| Market Cap | ₹33,964 Cr | Large-cap stock |
| Current Price | ₹2,538 | Near 52-week high |
| High / Low | ₹2,638 / ₹1,429 | Volatility observed |
| Stock P/E | 109 | Expensive valuation |
| Book Value | ₹187 | Premium valuation |
| Dividend Yield | 0.12% | Low dividend payout |
| ROCE | 13.2% | Efficient capital utilization |
| ROE | 11.3% | Moderate return on equity |
| Debt to Equity | 0.36 | Manageable debt levels |
| Net Profit | ₹311 Cr | Strong earnings growth |
| Profit Growth | 31.8% | Robust profitability expansion |
| Promoter Holding | 40.2% | Stable ownership structure |
| Public Holding | 16.0% | Moderate retail participation |
🚀 Growth Drivers & Market Outlook of Radico Khaitan
Radico Khaitan’s strategic expansion into premium and luxury segments, coupled with strong brand positioning, is expected to drive revenue and earnings growth.
🔥 Key Growth Catalysts
- Premiumization Strategy: Increasing focus on high-margin products like Rampur Indian Single Malt and Jaisalmer Indian Craft Gin.
- Backward Integration: Investment in grain-based ENA production ensures quality control and cost efficiency.
- Market Expansion: Growing presence in Maharashtra, Karnataka, Telangana, and West Bengal.
- Strong Distribution Network: Over 100,000 retail outlets and 10,000 on-premise locations.
📈 Future Projections
| Year | Revenue (₹ Cr) | EBITDA (₹ Cr) | Net Profit (₹ Cr) | EPS (₹) | ROE (%) |
|---|---|---|---|---|---|
| FY24A | 41,185 | 5,061 | 2,558 | 19.1 | 11.3 |
| FY25E | 47,361 | 6,626 | 3,437 | 25.7 | 13.7 |
| FY26E | 54,567 | 8,188 | 4,955 | 37.1 | 17.3 |
| FY27E | 63,377 | 10,150 | 6,610 | 49.5 | 19.6 |
💡 Final Thoughts
Radico Khaitan’s technical and fundamental indicators suggest a promising investment opportunity. The Cup with Handle Pattern and 100MA above 200MA indicate bullish momentum, while strong financials and strategic expansion reinforce long-term growth potential.
⚠️ Important Note: As per SEBI guidelines, we do not offer investment advice or target prices. Always consult with a SEBI-registered financial advisor before making investment decisions.
You can also see ” Cup with Handle Pattern” on PNB Housing Finance
Leave a Reply