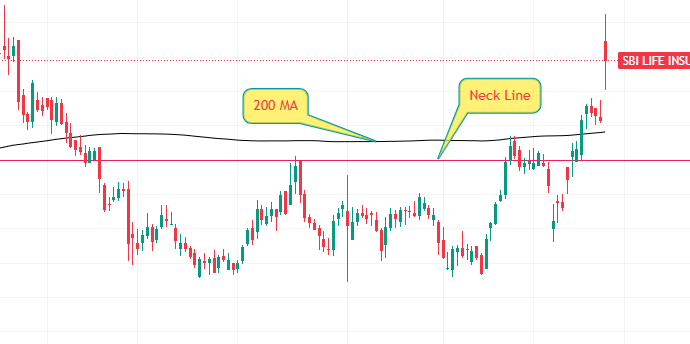
The SBI Life Chart Pattern presents an intriguing opportunity for technical analysis enthusiasts. Showcasing a W pattern breakout coupled with the price crossing above the 200-day moving average (200 MA), this chart demands attention for its potential insights into market sentiment and price action.
Understanding SBI Life Chart Pattern (“W” Pattern)
The “W” pattern, commonly referred to as a double bottom, is a classic bullish reversal chart formation. This pattern indicates that the stock has encountered a significant support level twice and has successfully rebounded, failing to break below it. The two distinct troughs resemble the shape of the letter “W.”
In the case of the SBI Life Chart Pattern, the W pattern is prominent, with the price action confirming the breakout above the neckline—a key resistance level. This breakout is often interpreted as a sign of strengthening buying interest and a possible upward trend.
The Role of the 200-Day Moving Average
The 200-day moving average (200 MA) holds significant weight in technical analysis, as it helps investors gauge the stock’s long-term trend. When the price moves above the 200 MA, it is often viewed as a bullish signal, suggesting that the stock may continue to perform well over the longer term.
In the SBI Life chart, the price crossing above the 200 MA aligns with the bullish implications of the W pattern breakout. This confluence of technical indicators strengthens the argument for a positive market sentiment surrounding the stock.
Neckline Breakout: A Critical Moment
The neckline, which serves as the resistance level in the W pattern, is a crucial element for validating the pattern’s breakout. For SBI Life, the price’s decisive move above the neckline suggests the possibility of sustained momentum, as traders and investors respond to this technical signal.
Conclusion
The SBI Life chart exemplifies how technical analysis can provide insights into potential price movements. The W pattern breakout, supported by the price crossing above the 200 MA, offers an engaging case study for traders and investors alike. While this analysis highlights the significance of these indicators, it’s crucial to combine technical findings with broader market research and fundamental analysis for well-rounded decision-making.
SBI Life Chart Pattern: A Fundamental Analysis
SBI Life Insurance Company Ltd. stands as a prominent player in the Indian life insurance sector, showcasing consistent growth and market leadership. This article delves into the fundamental aspects of SBI Life, highlighting its financial performance, operational efficiency, and strategic focus, while optimizing for the keyword SBI Life Chart Pattern.
Financial Performance
SBI Life has demonstrated resilience in its financial metrics, with its Annual Premium Equivalent (APE) growing by 9% to ₹214 billion in FY25. Despite muted growth in Q4FY25 (+2% YoY), the company has maintained its leadership position in the private life insurance space, commanding a significant market share. The Value of New Business (VNB) margin stood at 27.8% in FY25, reflecting the company’s focus on profitable product segments.
| Aspect | Details |
|---|---|
| Financial Performance | APE grew 9% to ₹214 billion in FY25; VNB margin stood at 27.8%. |
| Product Mix | Shift towards traditional products, Non-par business grew 21% YoY, contributing 18% to APE. |
| Operational Efficiency | Expense ratio at 9.7% for FY25; agency channel improved productivity by 20%. |
| Embedded Value (EV) | EV grew 21% YoY to ₹702.5 billion in FY25; solvency ratio stood at 196%. |
| Strategic Expansion | Added 70 branches in FY25; plans to add 87 branches in FY26. |
Product Mix and Strategic Focus
The company’s product mix reveals a strategic shift towards traditional products, particularly non-participating (Non-par) plans. Non-par business grew by 21% YoY in FY25, contributing 18% to the total APE. This shift aligns with the management’s focus on enhancing profitability amidst volatile equity markets that have subdued demand for Unit-Linked Insurance Plans (ULIPs).
Operational Efficiency
SBI Life’s operational efficiency is evident in its expense ratio, which stood at 9.7% in FY25. The agency channel has shown improved productivity, with individual New Business Premium (NBP) per agent increasing by 20%. The company has also expanded its reach by adding 70 branches in FY25, with plans to add 87 more in FY26.
Embedded Value and Growth Prospects
The Embedded Value (EV) of SBI Life grew by 21% YoY to ₹702.5 billion in FY25. This growth underscores the company’s ability to generate sustainable value for its stakeholders. The solvency ratio of 196% further highlights its financial stability.
Leave a Reply