• Skip to main content
  • Skip to secondary menu
  • Skip to primary sidebar
  • Skip to footer
  • Home
  • About Us
  • Privacy Policy
  • Contact Us

Techno Funda

Share, Mutual Funds, Insurance, PF

  • STOCK RESEARCH REPORT
  • Break out stocks for tomorrow
  • MUTUAL FUND
  • INSURANCE

PNB Chart Pattern: A Comprehensive Technical Analysis

April 27, 2025 by Tapan Das Leave a Comment

The recent price action of Punjab National Bank (PNB) has showcased a classic Cup with Handle chart pattern, a widely-recognized bullish continuation pattern in technical analysis. Here’s a breakdown of the significant elements of this pattern:

PNB Chart Pattern: Cup with Handle Formation

The Cup with Handle is identified by a “U”-shaped consolidation phase followed by a smaller pullback that resembles a handle. In PNB’s case, the cup indicates a period of accumulation, where the price gradually recovers from previous lows, showing strength and potential for a breakout.

PNB Chart Pattern: Neckline Support

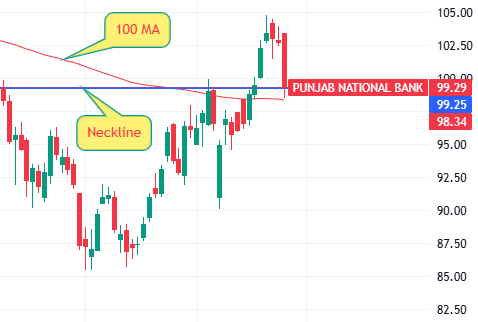
The neckline of the Cup with Handle pattern often acts as a critical support level during pullbacks. As the price retraced to this level, it indicated buyers stepping in to defend the support, solidifying the formation’s validity.

PNB Chart Pattern :100-Day Moving Average (100 MA)

The 100-day moving average played a pivotal role in PNB’s technical setup. After the price successfully broke above the 100 MA, it came back to retest it, confirming this moving average as a strong dynamic support. Such a retest indicates healthy consolidation before resuming the upward momentum.

PNB Chart Pattern: Breakout Confirmation

For the Cup with Handle pattern, the breakout above the handle’s resistance level is a key signal for bullish continuation. In PNB’s chart, the breakout from the handle indicated an increase in trading volume, which is a positive sign of strong participation from market participants.

PNB Chart Pattern: Conclusion

The PNB chart pattern reveals a textbook example of a bullish setup, with well-defined supports and a successful breakout. Traders focusing on technical analysis can draw insights from this pattern to formulate informed strategies. However, it’s always prudent to combine chart patterns with other indicators and fundamental analysis for a holistic view.

Fundamental Overview
Punjab National Bank (PNB), India’s first Swadeshi Bank, offers banking and financial services backed by strong fundamentals. Established in 1895, it is the third-largest PSU bank in India by market capitalization. PNB’s key metrics display its financial resilience and potential for sustainable growth. Here’s a snapshot of its fundamentals:

MetricValueInsights
Current Price₹99.50Trading below its book value of ₹114.
Target Price₹111Offers a potential upside of 11.60%.
Market Cap₹1,14,355 CrReflects its significant market presence.
Promoter Holding70.08%Indicates strong government backing.
Dividend Yield1.51%Provides steady returns to shareholders.
Debt-to-Equity Ratio12.4Highlights its leverage position.
Return on Equity (ROE)8.54%Demonstrates efficient profitability.
Price-to-Earnings (PE)6.79Suggests undervaluation compared to peers.

These financial metrics underline PNB’s robust business model and investor appeal, supported by balanced credit and deposit mixes, improving asset quality, and strategic growth initiatives.

Filed Under: STOCK RESEARCH REPORT

Reader Interactions

Leave a Reply Cancel reply

Your email address will not be published. Required fields are marked *

Primary Sidebar

Categories

  • Break out stocks for tomorrow
  • Information
  • INSURANCE
  • MUTUAL FUND
  • STOCK RESEARCH REPORT
CAGR Calculator

CAGR Investment Calculator

Enter Investment Details

More to See

JIO Mutual Fund: Will It Disrupt the Industry or Just Make It Smarter?

June 6, 2025 By Tapan Das

PM Kisan 20th Installment Date: What Farmers Need to Know in June 2025

June 5, 2025 By Tapan Das

Why IRCON Share Price Is Rising: A Technical & Fundamental Deep Dive

June 5, 2025 By Tapan Das

FII Comeback: Why Foreign Institutional Investors Are Returning to Indian Stock Market

June 4, 2025 By Tapan Das

SEBI’s F&O Revolution: 9 New F&O Rules Every Trader Must Know in 2025

June 2, 2025 By Tapan Das

JK Lakshmi Cement Share – Riding on Strong Fundamentals and Operational Excellence

June 1, 2025 By Tapan Das

Samvardhana Motherson Share: Navigating Growth Amid Industry Challenges

May 31, 2025 By Tapan Das

Jindal Steel Share: Inside the Ambitious Growth Path of JSPL

May 30, 2025 By Tapan Das

Esab India: A Glimpse Into the Steady Performer in Industrial Growth

May 29, 2025 By Tapan Das

Linde India Share: A Deep Dive into a Quiet Industrial Giant

May 28, 2025 By Tapan Das

Footer

Recent

  • Why Yatharth Hospital Is Quietly Emerging as a Healthcare Force in India
  • JIO Mutual Fund: Will It Disrupt the Industry or Just Make It Smarter?
  • PM Kisan 20th Installment Date: What Farmers Need to Know in June 2025
  • Why IRCON Share Price Is Rising: A Technical & Fundamental Deep Dive
  • FII Comeback: Why Foreign Institutional Investors Are Returning to Indian Stock Market

Tags

Best Pension Plan 2025 breakout stocks bullish breakout bullish chart pattern Cams Cup with Handle Pattern Cams Share Breakout Cams Share Price Cup with Handle Breakout Cams Share Price Momentum Above 100 MA Cams Share Price Trend Reversal Pattern Cams Share Resistance and Support Cams Share Retesting Neckline Support Cams Share Trading Strategy Cams Stock Chart Pattern Cams Stock Moving Average Cams Technical Chart candlestick patterns Cotton Yarn cup with handle pattern How to Read Cams Share Technical Chart Immediate Pension Plan Indian stock market Indian Textile Exports India UK FTA Is Cams Share a Good Buy Now? ITC share price trend LIC Annuity Plan LIC Pension Plan LIC Pensoin Calculator Life Annuity LIC NSE stocks Polyester Yarn price action trading rbl bank share Retirement planning India share market Spinning Mills stock breakout Stock breakout patterns Stock chart patterns Stock market blog India stock market india technical analysis textile industry Textile Industry in India trading strategies

Copyright © 2026 · Magazine Pro on Genesis Framework · WordPress · Log in