Can Fin Homes Chart Pattern: Technical Analysis
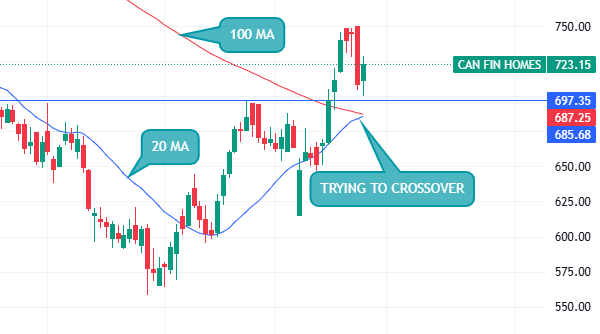
The Can Fin Homes Chart Pattern is currently displaying a promising Cup with Handle pattern, a classic bullish continuation signal in technical analysis. This pattern typically indicates a potential upward movement, with the “cup” representing a rounded consolidation phase and the “handle” signifying a brief pullback before the breakout. Adding to the optimism, the 20-day moving average (20 MA) is attempting to cross over the 100-day moving average (100 MA). Such a crossover often signals a shift in momentum, suggesting that the stock might be gearing up for a strong rally. Traders and investors should monitor these technical indicators closely, as they could provide valuable insights into the stock’s future trajectory.
Can Fin Homes Chart Pattern: Fundamental Analysis
Can Fin Homes, a leading player in India’s housing finance sector, has consistently demonstrated robust financial performance. The company specializes in affordable housing loans, catering to middle and lower-income groups—a segment with significant growth potential in India. Can Fin Homes has maintained a healthy asset quality, with low non-performing assets (NPAs), reflecting its prudent risk management practices. Recent reports highlight the company’s strategic initiatives, such as expanding its branch network and leveraging technology to enhance customer experience. Additionally, Can Fin Homes has received favorable ratings from credit agencies, underscoring its strong financial position. With a focus on sustainable growth and customer-centric services, Can Fin Homes continues to be a reliable choice in the housing finance industry.
This blend of technical and fundamental insights paints a compelling picture of Can Fin Homes’ potential. While the technical chart suggests bullish momentum, the company’s solid fundamentals provide a strong foundation for long-term growth.
Can Fin Homes Chart Pattern: Key Metrics and Highlights
Can Fin Homes has shown consistent growth in its financials, demonstrating a strong position in the housing finance sector. Below is a summary of key fundamental details:
| Metric | FY25 | YoY Change | FY26E |
|---|---|---|---|
| AUM (Assets Under Management) | ₹38,217 Cr | 9% | ₹42,436 Cr |
| Disbursements | ₹2,455 Cr | 6% YoY, 31% QoQ | ₹10,500 Cr (Guidance) |
| Net Interest Income (NII) | ₹1,354 Cr | 7.6% | ₹1,511 Cr |
| Net Revenue | ₹1,392 Cr | 7.6% | ₹1,553 Cr |
| PAT (Profit After Tax) | ₹857 Cr | 14.1% | ₹935 Cr |
| EPS (Earnings Per Share) | ₹64 | 14.1% | ₹70 |
| GNPA (Gross Non-Performing Assets) | 0.87% | Improved by -5 bps QoQ | ~0.8% (Expected Stability) |
| NNPA (Net Non-Performing Assets) | 0.46% | Improved by -4 bps QoQ | ~0.4% |
Fundamental Strengths
- Asset Quality: Can Fin Homes maintains excellent asset quality with GNPA at 0.87% and NNPA at 0.46%, reflecting strong risk management practices.
- Revenue Growth: The company’s net revenue rose to ₹365 Cr in Q4FY25, driven by higher disbursements and new loan approvals.
- Profitability: PAT increased by 12% YoY in Q4FY25, supported by lower credit costs and tax expenses.
- Return Metrics: Can Fin Homes exhibits strong return ratios—RoAA at 2.6% and RoAE at 18.5%, underscoring efficient operations and profitability.
- Focus Areas: The company is undergoing a tech transformation and IT upgrades to enhance operational efficiency, despite short-term elevated costs.
Can Fin Homes remains a robust player in the housing finance industry, with attractive valuations and a growth-oriented outlook for FY26.
Leave a Reply