Today I will discuss about Atul LTD Chartpattern as per chart pattern. Discussion about Atul LTD Chartpattern is for only education purpose. This is just a pattern for education purposes and remember it is not a stock buying & selling recommendation. It is just an educational purpose to learn how to pick a stock with technical and fundamental analysis. Please take an investment decision after consulting with your investment advisor. I am not SEBI registered, so do not follow me as a stock advisor. Just learn from me how to do technical and fundamental analysis.
ATUL Ltd Chart Pattern and Key Observations
Technical analysis plays a crucial role in understanding stock behavior, and ATUL Ltd’s chart provides fascinating insights into its price trends and patterns. By carefully studying support and resistance levels, along with moving averages, traders and investors can gain an edge in analyzing market movements.
Resistance Becomes Support: On Weekly Atul LTD Chartpattern
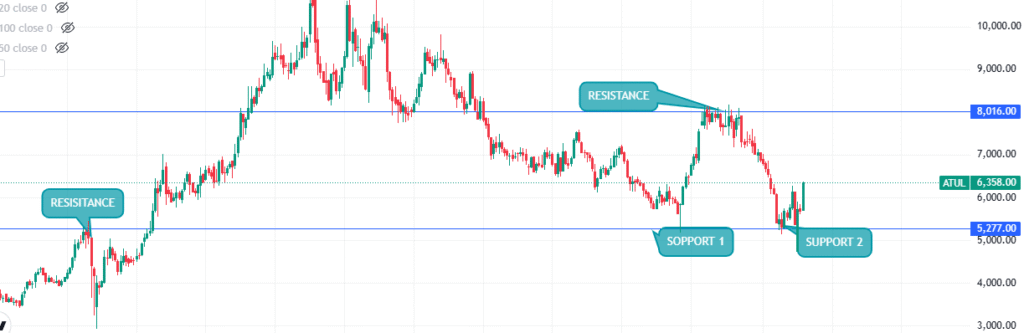
One of the most noteworthy features on ATUL Ltd’s daily chart is the ₹5,227 level, which initially served as a strong resistance. Historically, this level acted as a ceiling, limiting upward price movements. However, in June 2024 and April 2025, the same level transitioned into a support zone, signaling a significant shift in market sentiment.
When a resistance turns into support, it reflects growing confidence among buyers. This transition is often viewed as a bullish indication, as it suggests that market participants are willing to step in and buy at higher levels.
Role of Moving Averages in Atul LTD Chartpattern
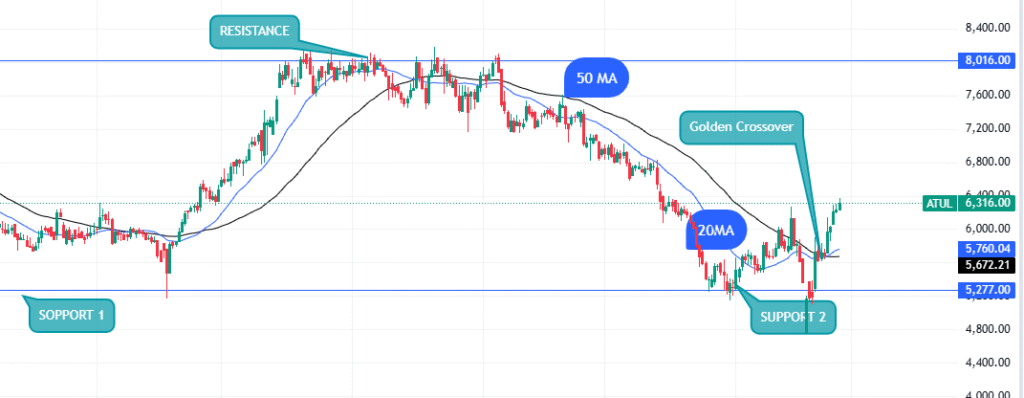
The 20-day and 50-day moving averages (MA) plotted on the chart provide further clarity about the stock’s momentum. The “golden crossover,” where the 20-day MA crosses above the 50-day MA, is visible and supports the bullish outlook. This crossover is a widely followed technical signal, indicating the potential for sustained upward momentum.
Business Overview
Atul Ltd is a highly diversified and integrated chemicals company, operating across multiple segments. It has a strong legacy in the chemicals industry, having been established in 1947. With operations across Life Science Chemicals and Performance & Other Chemicals, it serves diverse industries like crop protection, pharmaceuticals, polymers, aromatics, dyes, and bulk chemicals. The company is actively leveraging backward integration and product portfolio expansion to strengthen its position.
Financial Performance
- Revenue Growth: Atul reported stable revenue growth at a CAGR of 8% over FY21–FY24, and is expected to achieve 15% CAGR during FY24–FY27E. Growth is primarily driven by ramp-up of existing and new capacities, like caustic soda and epoxy resin plants, and improved capacity utilization across major segments such as polymers and aromatics.
- Profitability Metrics:
- EBITDA margins are set to improve from 13.5% in FY24 to ~19–20% by FY27E, supported by backward integration and operating leverage from capacity expansions.
- PAT CAGR is projected at ~37% for FY24–27E, reflecting strong operational efficiencies.
- Operating Cash Flow: With robust OCF generation expected (around ₹10 billion annually by FY27E), Atul is positioned to fund capex and strengthen its balance sheet.
Segmental Highlights
- Life Science Chemicals:
- Crop Protection: Growth driven by debottlenecking in key products like 2,4-D and expansion in retail formulations. The ongoing ADD investigation by the US could benefit the company with increased market share and pricing leverage in exports.
- Pharmaceuticals: Steady growth expected with focus on regulatory clearances, new product introductions, and strategic customer alliances.
- Performance & Other Chemicals:
- Polymers: New epoxy resin capacities (50ktpa) are crucial for sustained revenue growth. The retail segment of polymers will take time to scale given market competition.
- Aromatics: Ramp-up in utilization of para-cresol capacity (36ktpa) and debottlenecking downstream products are likely to drive growth.
- Bulk Chemicals: Margins to improve with captive consumption of caustic soda and its derivatives.
- Colors: Sulfur black dye capacity expansion positions Atul to capture opportunities from China’s regulatory challenges in the industry.
Key Strengths
- Backward Integration: Investments in caustic soda, MCA, and other captive facilities enhance margin profiles and mitigate supply risks.
- Diversified Portfolio: Atul’s presence across Life Sciences and Performance Chemicals segments shields it from industry cyclicality.
- Strong Balance Sheet: Negative net debt, consistent reinvestment, and ramp-up of capacities provide financial stability.
Challenges
- Capex Utilization Risk: Prolonged ramp-up periods for new capacities could affect forecasts.
- Commoditized Product Exposure: Margins from caustic soda and other bulk chemicals may face pressure in declining price scenarios.
- External Factors: Trade wars and anti-dumping investigations in key markets could influence pricing dynamics.
Valuation Metrics
- P/E ratios are expected to contract from ~35x in FY25E to ~21x by FY27E, signaling earnings growth and re-rating potential.
- RoCE and RoIC are projected to recover sharply over FY25–FY27E, reflecting operational leverage.
Atul Ltd exhibits strong growth potential backed by its integrated business model and recent investments, but operational execution, external risks, and competitive pressures remain key watchpoints. Let me know if you’d like to explore any segment in detail or refine specific metrics further!
Leave a Reply